To graph an inequality you must first determine the solution to the problem as if it were an equality. This will give you the boundary point. In this video, we will look at the finer details of what to do to find and graph the solution set.
Let’s continue this idea by looking at a few more examples of graphing inequalities.
Graph: $ \color{#2f6683}{x-7 \geq 3}$
1. Solve the inequality as if it was an equation:
\[\begin{align*}
x-7&=3\\
x+{^-7}&=3\\
x+{^-7}\color{#2f6683}{+7}&=3\color{#2f6683}{+7}\\
x&=10
\end{align*}\]
2. Use the value you got as the boundary point for the graph: $x\geq 10$
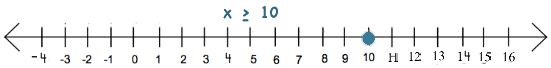
3. Make a few points that make $x\geq 10$ true
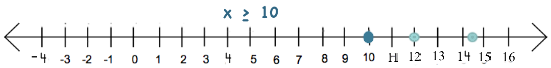
4. Draw a line from the boundary point that will represent all possible solutions to the inequality.

Remember the closed circle means that 10 is part of the solution set.

5. Pick a point from the solution set and check it in the original inequality,
such as $\color{#2f6683}{x=12}$
\[\begin{align*}
x-7&\geq3 \\
\color{#2f6683}{12}+{^-7}&\geq3\\
\color{#2f6683}{5}&\geq3\\
\end{align*}\]
Graph: $ {\frac{n}{4}<12}$
1. Solve the inequality as if it was an equation:
\[\begin{align*}
\frac{n}{4}&<12\\
\\[1px]
\color{#f15a23}{4*}\frac{n}{4}&<12\color{#f15a23}{*4}\\
\\[1px]
\color{#f15a23}{n}&<\color{#f15a23}{48}
\end{align*}
\]
2. Use the value you got as the boundary point for the graph.
3. Mark a few points that make $n<48$ true.
4. Draw a line from the boundary point that will represent all possible solutions to the inequality.

Remember the open circle means that 48 is not part of the solution set.
5. Pick a point from the solution set and check it in the original inequality, such as $\color{#f15a23}{x=40}$

\[\begin{align*}
\frac{n}{4}&<12\\
\\[1px]
\frac{40}{4}&<12\\
\\[1px]
\color{#f15a23}{10}&<12
\end{align*}\]