An Introduction to Graphing Inequalities
The video is an introduction to what an inequality is. We look at why we need inequalities and how to graph them.
Let’s continue this idea by looking at the finer details of graphing inequalities.
Graph: $ \color{blue}{x < 4}$
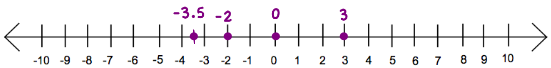
Lets start by graphing some of the numbers that make the statement $x < 4$ true.
These are only a few of the solutions. We use need to use a line to show that all the numbers less than 4 are included. Also by putting an open circle where the start of the solution is (around the 4) we are saying that while $3.99999$ is part of the solution set, 4 is not.
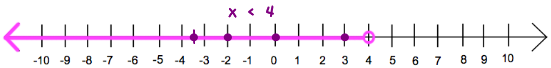
When the the number is not included in the solution set the circle is open.
Graph: $ \color{blue}{x \leq 4}$
Again we will use a line to show that all the numbers less than 4 are included, but this time we put a closed circle (which means that we color in the circle) around the number where the start of the solution is. So in this case, the filled in circle around the 4 is telling the reader that 4 is part of the solution set.
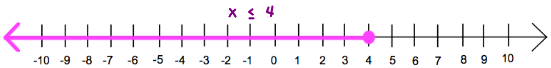
When the the number is included in the solution set the circle is filled in.
Graph: $ \color{blue}{x > 4}$
Pick a value for x to determine which way to draw the line representing the solution set. Since 6 is greater than 4 the line is drawn to the right.</>
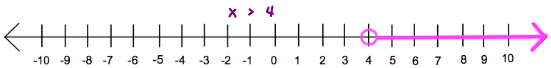
When the the number is not included in the solution set the circle is open.